Shell 脚本绘图实例使用gnuplot

gnuplot脚本绘图方法 使用 gnuplot 绘图首先要安装 gnuplot, 属于跨平台绘图工具,官网:http://www.gnuplot.info/
日志的格式:
PLOT	1	cumulative_loss_pkts:4292020747@-	810271.208000	0.000000
PLOT	1	received_seq_max_pkts:4292020747@-	810271.208000	32.000000
PLOT	1	AudioTotBitrate_kbps:1179260311@-	810271.208000	31.000000
PLOT	1	AudioNackBitrate_kbps:1179260311@-	810271.208000	0.000000
PLOT	1	cumulative_loss_pkts:4292020747@-	810271.226000	0.000000
PLOT	1	received_seq_max_pkts:4292020747@-	810271.226000	33.000000
PLOT	1	AudioTotBitrate_kbps:1179260311@-	810271.226000	32.000000
PLOT	1	AudioNackBitrate_kbps:1179260311@-	810271.226000	0.000000
PLOT	1	cumulative_loss_pkts:4292020747@-	810271.251000	0.000000
日志的搜索用到了grep 命令, 提取文本列用到了 awk 命令,文本替换 sed命令,cut 也可以提取文本列
参考:
绘图脚本为:
1
2
3
4
5
6
7
8
9
10
11
12
13
14
15
16
17
18
19
20
21
22
23
24
25
26
27
28
29
30
31
32
33
34
#!/bin/bash
## 要提取的日志的关键字信息,可以搜索多个,空格分开
search_str="AudioTotBitrate_kbps VideoTotBitrate_kbps received_seq_max_pkts Target_bitrate_kbps"

function gen_gnuplot_input {
    colors=(a7001f 0a60c2 b2582b 21a66c d6604d 4393c3 f4a582 92c5de edcbb7 b1c5d0)
    for str in $search_str ; do
        ## 从日志中搜索关键字后,提取第4列和第5列,并保存到 /tmp/ 目录下,存为csv格式
        grep $str $1 | awk '{printf $4 ", " $5 "\n"}' > /tmp/$str.csv
    done

    ## 设置 gnulot 绘图的一些属性,包括x 轴,y轴等信息,输出文件保存为png, 曲线的颜色等等
    echo -n "
    set key box;
    set datafile separator \",\";
    set terminal png size 1440,900 font \"Arial,9\";
    set xlabel \"Seconds\";
    set ylabel 'bitrate (kbps)';
    set y2label 'time delta (ms)';
    set output \"$1.png\";
    set samples 50;
    set style data points;"

    i=0

    ## 从上面保存的csv文件读取源数据集,并执行绘图命令
    echo -n  "plot"
    for str in $search_str ; do
       (( ++i )) && echo -n "'/tmp/$str.csv' using 1:2 \"%lf,%lf\" with line lc rgb \"#${colors[$(($i % 10))]}\" title \"$str\","
    done
}

## 将第一次终端传入参数,即要分析的日志文件名,传到函数中,处理后,用gnullot画图
gen_gnuplot_input $1  | gnuplot -persist
最终绘图效果: 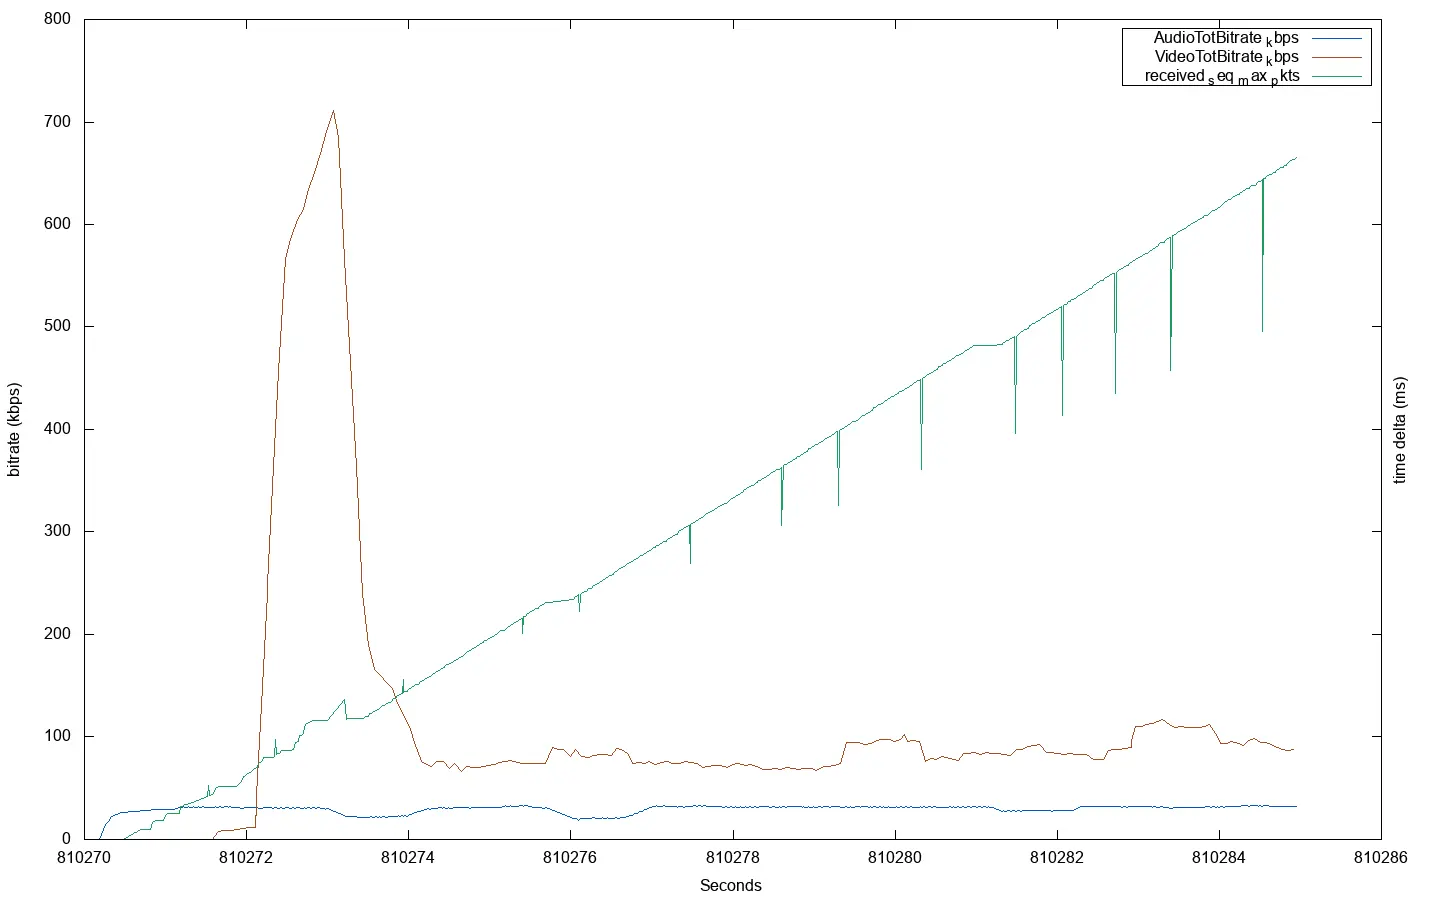
本文由作者按照 CC BY 4.0 进行授权